| term | estimate | std.error | statistic | p.value |
|---|---|---|---|---|
| (Intercept) | -57.9877 | 8.6382 | -6.7129 | 0.0000 |
| Girth | 4.7082 | 0.2643 | 17.8161 | 0.0000 |
| Height | 0.3393 | 0.1302 | 2.6066 | 0.0145 |
10 An Intro to Multiple Regression
“Statisticians, like artists, have the bad habit of falling in love with their models.” - George Box
10.1 Types of Models
When we discuss the simple linear regression model \[ \begin{align*} y = \beta_0 + \beta_1 x +\varepsilon \end{align*} \] we stated previously that it is “simple” because there is only one predictor variable.
The model is “linear in the parameters” because every parameter is only to the first power and is not multiplied or divided by another parameter.
The model is also “linear in the predictor variable” because \(x\) appears only with an exponent of one (instead of \(x^2\), \(x^{1/2}\), etc.).
A “linear model” means it is linear in the parameters (not necessarily linear in the predictor variables). A model that is linear in both the parameters and the predictor variables is called a first-order model.
ExampleExample 10.1: Linear in parameters versus linear in predictors
The word “linear” can be sneaky because it can refer to two different ideas.
| Model | Linear in the parameters? | Linear in the predictor variables? | First-order model? |
|---|---|---|---|
| \(y=\beta_0+\beta_1x+\varepsilon\) | Yes | Yes | Yes |
| \(y=\beta_0+\beta_1x+\beta_2x^2+\varepsilon\) | Yes | No | No |
| \(y=\beta_0+\beta_1\log(x)+\varepsilon\) | Yes | No | No |
| \(y=\beta_0+\beta_1x_1+\beta_2x_2+\beta_3x_1x_2+\varepsilon\) | Yes | No, because of the product term | No |
| \(y=\beta_0+\beta_1^2x+\varepsilon\) | No | Yes | No |
Regression courses usually use the phrase “linear regression” to mean linear in the parameters. That means transformations of predictors, polynomial terms, and interaction terms can still be part of a linear regression model.
10.2 Multiple Predictor Variables
Often when modeling some response variable \(y\), one predictor variable may not be adequate. Thus, multiple predictor variables can be used to model \(y\).
As in simple linear regression, we will assume models that are linear in the parameters.
We will present the multiple linear regression model that is linear in the parameters but not necessarily linear in the predictor variables. This type of model is called the general linear regression model.
10.2.1 The Multiple Regression Model
The general model is \[ \begin{align} y_{i}= & \beta_{0}+\beta_{1}x_{i1}+\beta_{2}x_{i2}+\cdots+\beta_{p-1}x_{i,p-1}+\varepsilon_{i}\\ = & \beta_{0}+\sum_{k=1}^{p-1}\beta_{k}x_{ik}+\varepsilon_{i}\\ & \varepsilon\overset{iid}{\sim}N\left(0,\sigma^{2}\right) \end{align} \tag{10.1}\] where \[ \begin{align*} & \beta_{0},\beta_{1},\ldots,\beta_{p-1}\text{ are parameters}\\ & x_{i1},\ldots,x_{i,p-1}\text{ are known constants}\\ & i=1,\ldots,n \end{align*} \]
ExampleExample 10.2: Interpreting a partial slope
Suppose we model a student’s exam score using hours studied and number of missed classes:
\[ score_i=\beta_0+\beta_1hours_i+\beta_2missed_i+\varepsilon_i. \]
The coefficient \(\beta_1\) is the expected change in exam score for a one-unit increase in hours studied, holding the number of missed classes constant.
The phrase “holding the other predictor constant” is the key new interpretation in multiple regression. A multiple-regression slope is a partial effect, not just the raw relationship between one predictor and the response.
The predictor variable \(x_{k}\) can be raised to some power or transformed in some other way. Also, the predictor variable can be the product of two variables. When this is the case, we say the term is an interaction term. We will discuss these more later.
10.2.2 Assumptions About the Predictor Variables
In multiple regression, we are interested in how the predictor variables relate to the response variable. In particular, we want to know:
- How important are the different predictor variables in modeling \(y\)?
- What is the effect of a given predictor variable on predicting \(y\)?
- Are any of the predictor variables unnecessary in modeling \(y\) and therefore be dropped from the model?
- Are there any predictor variables not included in the model that should be included?
These questions are relatively simple to answer if the predictor variables are uncorrelated among themselves.
Unfortunately, in real-world applications, especially for observational studies, the predictor variables tend to be correlated among themselves. When this is the case, we say that multicollinearity exists.
ExampleExample 10.3: Why correlated predictors complicate interpretation
Suppose we model house price using square footage and number of bedrooms.
Larger houses often have more bedrooms, so these two predictors are usually correlated. If both predictors are in the model, the slope for square footage describes the relationship between square footage and price among houses with the same number of bedrooms. The slope for bedrooms describes the relationship between bedrooms and price among houses with the same square footage.
Those are useful questions, but they are more subtle than the simple-regression question “How does price change as square footage changes?” Multicollinearity makes it harder to separate the unique contribution of each predictor.
Just due to chance, there will always be some correlation among the predictor variables. In general, we will assume the correlation among the predictor variables is low. If the correlation is high, then this may present problems in the analyses. As we discuss the inferences and assumptions going further, we will discuss the problem of multicollinearity in more detail.
10.3 Estimating the Multiple Regression Model
10.3.1 Minimizing the SSE
As we did in the simple linear regression case, we want to fit model Equation 10.1 to the observed data.
The fitted line in the multiple regression case is \[ \begin{align} \hat{y}_i = b_0 + b_1 x_{i1} + b_2 x_{i2}+\cdots +b_{p-1}x_{i,p-1} \end{align} \tag{10.2}\] The estimates \(b_0,b_1,\ldots,b_{p-1}\) are found by minimizing the squared distances between the observed values \(y_i\) and the fitted values \(\hat{y}_i\). The sum of the squared distances is now \[ \begin{align} Q=\sum \left(y_i-\left(b_0 + b_1 x_{i1} + b_2 x_{i2}+\cdots +b_{p-1}x_{i,p-1}\right)\right)^2 \end{align} \tag{10.3}\] in the multiple regression case.
Note that model Equation 10.1 is no longer a line. It is a plane when \(p=3\) and a hyperplane when \(p>3\).
10.3.2 Case with Two Predictor Variables
When there are two predictor variables (\(p=3\)), we will take three partial derivatives of Equation 10.3 with respect to \(b_0\), \(b_1\), and \(b_2\). This leads us to \[ \begin{align} \frac{\partial Q}{\partial b_{0}} & =-2\sum\left(y_{i}-b_{0}-b_{1}x_{i1}-b_{2}x_{i2}\right)\\ \frac{\partial Q}{\partial b_{1}} & =-2\sum x_{i1}\left(y_{i}-b_{0}-b_{1}x_{i1}-b_{2}x_{i2}\right)\\ \frac{\partial Q}{\partial b_{2}} & =-2\sum x_{i2}\left(y_{i}-b_{0}-b_{1}x_{i1}-b_{2}x_{i2}\right) \end{align} \tag{10.4}\]
10.3.3 The Normal Equations
Setting the partial derivative equal to zero and rearranging the terms lead us to the normal equations \[ \begin{align} \sum y_{i} & =nb_{0}+b_{1}\sum x_{i1}+b_{2}\sum x_{i2}\\ \sum x_{i1}y_{i} & =b_{0}\sum x_{i1}+b_{1}\sum x_{i1}^{2}+b_{2}\sum x_{i1}x_{i2}\\ \sum x_{i2}y_{i} & =b_{0}\sum x_{i2}+b_{1}\sum x_{i1}x_{i2}+b_{2}\sum x_{i2}^{2} \end{align} \tag{10.5}\]
10.3.4 The Least Squares Estimators
Solving the normal equations for \(b_0\), \(b_1\), and \(b_2\) gives us the least squares estimators \[ \begin{align} b_{1} & =\frac{\left(\sum x_{i2}^{2}\right)\left(\sum x_{i1}y_{i}\right)-\left(\sum x_{i1}x_{i2}\right)\left(\sum x_{i2}y_{i}\right)}{\left(\sum x_{i1}^{2}\right)\left(\sum x_{i2}^{2}\right)-\left(\sum x_{i1}x_{i2}\right)^{2}}\\ b_{2} & =\frac{\left(\sum x_{i1}^{2}\right)\left(\sum x_{i2}y_{i}\right)-\left(\sum x_{i1}x_{i2}\right)\left(\sum x_{i1}y_{i}\right)}{\left(\sum x_{i1}^{2}\right)\left(\sum x_{i2}^{2}\right)-\left(\sum x_{i1}x_{i2}\right)^{2}}\\ b_{0} & =\bar{Y}-b_{1}\bar{X}_{1}-b_{2}\bar{X}_{2} \end{align} \tag{10.6}\]
We see that the expression for the least squares estimators become cumbersome even for \(p=3\). As more variables are added to the model, the equations become even more cumbersome.
ExampleExample 10.4: Fitting a multiple regression model in R
The trees dataset contains measurements on the girth, height, and volume of 31 black cherry trees. A natural multiple regression model is
\[ Volume_i=\beta_0+\beta_1Girth_i+\beta_2Height_i+\varepsilon_i. \]
The estimated slope for Girth is 4.7082. Interpreted in the multiple-regression model, this means that for trees with the same height, a one-unit increase in girth is associated with an average increase of about 4.7082 cubic feet in predicted volume.
The estimated slope for Height is 0.3393. This means that for trees with the same girth, a one-unit increase in height is associated with an average increase of about 0.3393 cubic feet in predicted volume.
The important phrase in both interpretations is “with the other predictor held constant.”
WarningCommon interpretation mistake: partial slopes are conditional
In simple linear regression, it is natural to describe the slope as the relationship between \(x\) and \(y\).
In multiple regression, that wording is incomplete. A slope describes the relationship between one predictor and the response after accounting for the other predictors in the model.
For the trees model, the Girth slope should not be interpreted as the overall relationship between girth and volume. It is the expected change in volume for a one-unit increase in girth among trees with the same height.
That “holding the other predictors constant” phrase is not decorative. It is doing the heavy interpretive lifting.
ExampleExample 10.5: Visualizing a regression plane
With one predictor, the fitted values form a line. With two predictors, the fitted values form a plane.
The model
\[ \widehat{Volume}=b_0+b_1Girth+b_2Height \]
produces one predicted volume for each combination of girth and height.
girth_grid <- seq(min(trees$Girth), max(trees$Girth), length.out = 25)
height_grid <- seq(min(trees$Height), max(trees$Height), length.out = 25)

plane_grid <- expand.grid(
  Girth = girth_grid,
  Height = height_grid
)

plane_grid$predicted_volume <- predict(trees_fit, newdata = plane_grid)

volume_surface <- matrix(
  plane_grid$predicted_volume,
  nrow = length(girth_grid),
  ncol = length(height_grid)
)

regression_plane <- persp(
  x = girth_grid,
  y = height_grid,
  z = volume_surface,
  theta = 35,
  phi = 25,
  expand = 0.6,
  col = "lightblue",
  border = "gray80",
  ticktype = "detailed",
  xlab = "Girth",
  ylab = "Height",
  zlab = "Predicted volume"
)

points(
  trans3d(
    x = trees$Girth,
    y = trees$Height,
    z = trees$Volume,
    pmat = regression_plane
  ),
  pch = 19,
  col = "darkgreen"
)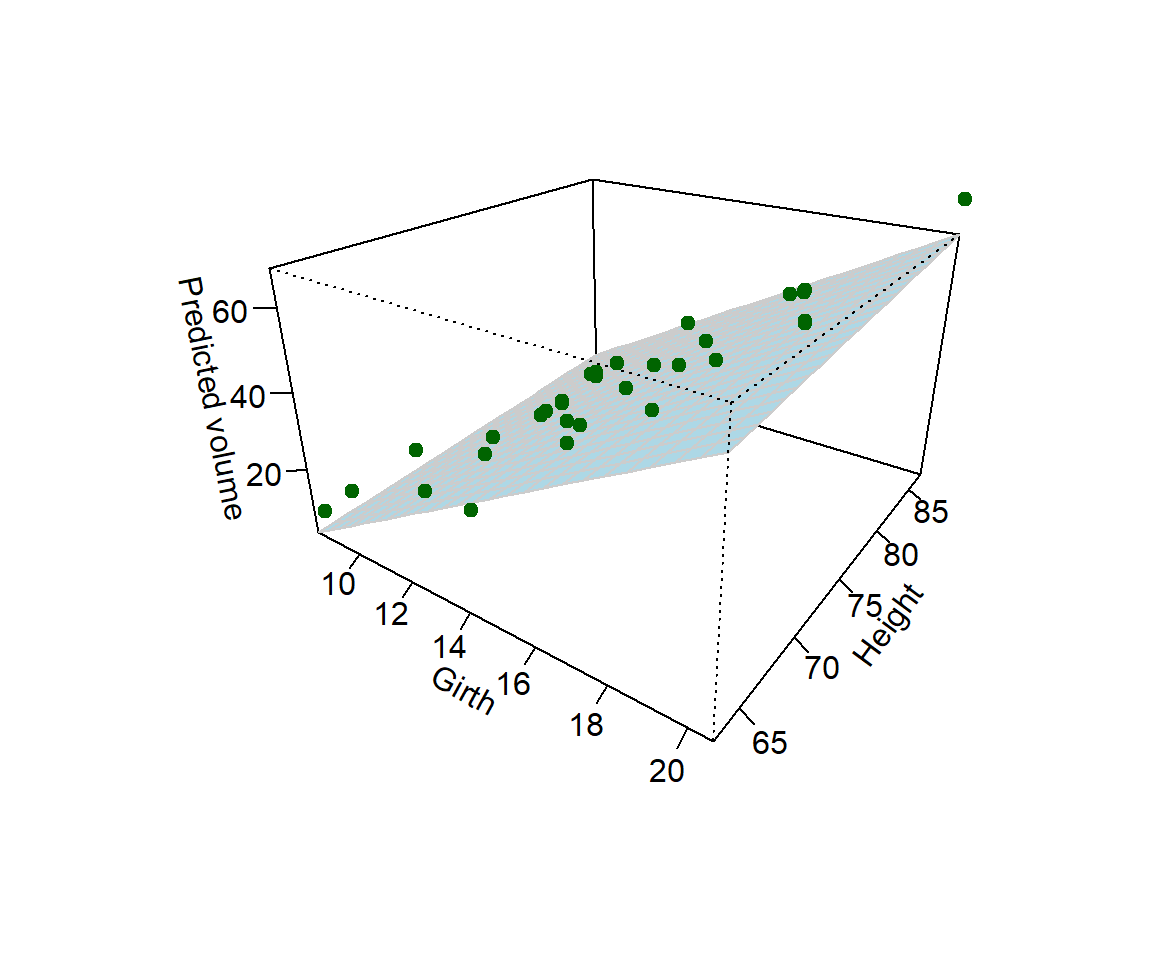
The blue surface represents the fitted regression plane. The green points represent the observed trees. Each residual is the vertical distance between an observed point and the fitted plane.
NoteFrom line to plane to hyperplane
The geometry changes as predictors are added:
- one predictor gives a fitted line,
- two predictors give a fitted plane,
- three or more predictors give a fitted hyperplane.
The word “hyperplane” sounds fancy, but the idea is the same: the model is still producing fitted values by combining predictors linearly in the parameters.
We can simplify notation by utilizing matrices to represent the model. We will present some basic notation and operations for matrices and then present the model using matrices.
10.4 A Primer on Matrices
10.4.1 Matrices
A matrix is a rectangular array of elements arranged in rows and columns.
An example of a matrix is: \[\begin{align*} \left[\begin{array}{ccc} 8.3 & 70 & 10.3\\ 8.6 & 65 & 10.3\\ 8.8 & 63 & 10.2\\ 10.5 & 72 & 16.4\\ \end{array}\right] \end{align*}\]
This matrix represents some of the data from the dataset. The values in the first column represent Girth, the second column represents Height, and the third column represents Volume.
Each row corresponds to a tree. The first row represents the values for the first tree. It has 8.3 for Girth, 70 for Height, and 10.3 for Volume.
So this matrix gives the values of three variables for four trees.
ExampleExample 10.6: The data matrix behind the `trees` example
The first four rows of the trees data can be viewed as a matrix.
  Girth Height Volume
1   8.3     70   10.3
2   8.6     65   10.3
3   8.8     63   10.2
4  10.5     72   16.4
This matrix has 4 rows and 3 columns. The rows represent observational units, the individual trees. The columns represent variables measured on each tree.
In regression, it is useful to keep this distinction straight:
- rows usually correspond to observations,
- columns usually correspond to variables or model terms.
10.4.2 Notation
Each value of the matrix is called an element of that matrix. We denote the elements as \(a_{ij}\) for the element in the \(i\)th row and the \(j\)th column. Note that the first subscript identifies the row number and the second the column number.
So for the matrix above, the elements can be denoted as \[ \begin{align*} \left[\begin{array}{ccc} a_{11} & a_{12} & a_{13}\\ a_{21} & a_{22} & a_{23}\\ a_{31} & a_{32} & a_{33}\\ a_{41} & a_{42} & a_{43} \end{array}\right] \end{align*} \]
A matrix may be denoted by a symbol such as \(\bf{A}\), \(\bf{X}\), or \(\bf{Z}\). The matrix could also be a greek symbol such as \(\bf{\Omega}\). The symbol is in boldface to identify that it refers to a matrix.
Thus, we might define for the above matrix; \[ \begin{align*} \bf{A} =\left[\begin{array}{ccc} a_{11} & a_{12} & a_{13}\\ a_{21} & a_{22} & a_{23}\\ a_{31} & a_{32} & a_{33}\\ a_{41} & a_{42} & a_{43} \end{array}\right] \end{align*} \]
Another notation we could use is: \[ \textbf{A}=\left[a_{ij}\right]\qquad i=1,\ldots,4; j=1,2,3 \]
This notation avoids the need for writing out all elements of the matrix by stating only the general element.
Sometimes we will specify the matrix with the dimension below the matrix symbol. For example, a \(r\) x \(c\) matrix can be expressed as
10.4.3 Matrix Dimensions
The dimension of the matrix above is 4 x 3, since there are four rows and three columns.
Recall that the trees dataset has 31 observations. So a matrix representing the full dataset would be 31 x 3.
Note that in giving the dimension of a matrix, we always specify the number of rows first and then the number of columns.
NoteRows first, columns second
Matrix dimensions are always written as
\[ \text{number of rows} \times \text{number of columns}. \]
For regression data, rows usually represent observations and columns usually represent variables or model terms. If a data matrix has 31 trees and 3 measured variables, its dimension is \(31\times3\), not \(3\times31\).
So a \(r\) x \(c\) matrix can be expressed as \[ \begin{align*} \underset{r\times c}{{\bf A}} & =\left[\begin{array}{cccc} a_{11} & a_{12} & \cdots & a_{1c}\\ a_{21} & a_{22} & \cdots & a_{2c}\\ \vdots & \vdots & \ddots & \vdots\\ a_{r1} & a_{r2} & \cdots & a_{rc} \end{array}\right] \end{align*} \] or in the compact form \[ \begin{align*} \underset{r\times c}{{\bf A}} & =\left[a_{ij}\right]\qquad i=1,\ldots,r;j=1,\ldots,c \end{align*} \] Again, the dimensions may or may not be given under the matrix symbol.
10.4.4 Square Matrices
A matrix is said to be square if the number of rows equals the number of columns. For example, the matrices \[
\begin{align*}
\left[\begin{array}{cc}
a_{11} & a_{12}\\
a_{21} & a_{22}
\end{array}\right]
\end{align*}
\] and
\[
\begin{align*}
\left[\begin{array}{ccc}
a_{11} & a_{12} & a_{13}\\
a_{21} & a_{22} & a_{23}\\
a_{31} & a_{32} & a_{33}\\
\end{array}\right]
\end{align*}
\] are both square matrices.
10.4.5 Vectors
A matrix containing only one column is called a column vector or simply a vector.
Two examples are: \[ \begin{align*} \textbf{A}=\left[\begin{array}{c} 1\\ 20\\ 7 \end{array}\right] & \qquad\textbf{B}=\left[\begin{array}{c} b_{1}\\ b_{2}\\ b_{3}\\ b_{4}\\ b_{5} \end{array}\right] \end{align*} \]
Note that the elements only have one subscript in \(\bf{B}\) since there is only one column. The subscript indicates only the row.
A matrix containing only one row is called a row vector.
Two examples are: \[ \begin{align*} \textbf{B}^{\prime}=\left[\begin{array}{ccc} 15 & 25 & 50\end{array}\right] & \qquad\boldsymbol{\delta}^{\prime}=\left[\begin{array}{cc} \delta_{1} & \delta_{2}\end{array}\right] \end{align*} \]
We use the prime (\({}^\prime\)) symbol for row vectors for reasons to be seen next.
10.4.6 Transpose
The transpose of a matrix \(\bf{A}\) is another matrix, denoted by \(\textbf{A}^{\prime}\), that is obtained by interchanging corresponding columns and rows of the matrix \(\bf{A}\).
For example, if: \[ \begin{align*} \underset{3\times2}{\textbf{A}}=\left[\begin{array}{cc} 1 & 7\\ 12 & 4\\ 5 & 9 \end{array}\right] \end{align*} \] then the transpose \(\bf{A}^\prime\) is: \[ \begin{align*} \underset{2\times3}{\textbf{A}^{\prime}}=\left[\begin{array}{ccc} 1 & 12 & 5\\ 7 & 4 & 9 \end{array}\right] \end{align*} \]
Note that the first column of \(\bf{A}\) is the first row of \(\bf{A}^\prime\), and similarly the second column of \(\bf{A}\) is the second row of \(\bf{A}^\prime\).
Note that the dimension of \(\bf{A}\) becomes reversed for the dimension of \(\bf{A}^\prime\).
Note that the transpose of a column vector is a row vector, and vice versa.
This is the reason why we used the symbol \(\bf{B}^\prime\) earlier to identify a row vector, since it may be thought of as the transpose of a column vector \(\bf{B}\).
10.4.7 Symmetric Matrices
A matrix is said to be symmetric if \(\bf{A}=\bf{A}^\prime\).
A symmetric matrix \(\bf{A}\) has elements \(a_{ij}=a_{ji}\). Clearly, a symmetric matrix must be a square matrix.
10.4.8 Diagonal Matrices
A square matrix is said to be diagonal if all of the off-diagonal elements are zero.
For example \[ \begin{align*} {\bf A} & =\left[\begin{array}{cccc} a_{11} & 0 & 0 & 0\\ 0 & a_{22} & 0 & 0\\ 0 & 0 & a_{33} & 0\\ 0 & 0 & 0 & a_{44} \end{array}\right] \end{align*} \] is a diagonal matrix.
10.4.9 Identity Matrix
The identity matrix is a diagonal matrix with ones for all the diagonal elements. The identity matrix is denoted with \(\bf{I}\).
For Example \[ \begin{align*} {\bf I} & =\left[\begin{array}{cccc} 1 & 0 & 0 & 0\\ 0 & 1 & 0 & 0\\ 0 & 0 & 1 & 0\\ 0 & 0 & 0 & 1 \end{array}\right] \end{align*} \] is a 4 x 4 identity matrix.
10.4.10 Matrices and Vectors of Ones and Zeros
A matrix with ones for all the elements is denoted as \[ \begin{align*} {\bf J} & =\left[\begin{array}{cccc} 1 & 1 & \cdots & 1\\ 1 & 1 & \cdots & 1\\ \vdots & \vdots & \ddots & \vdots\\ 1 & 1 & \cdots & 1 \end{array}\right] \end{align*} \]
A vector with ones for all the elements is denoted as \[ \begin{align*} {\bf 1} & =\left[\begin{array}{c} 1\\ 1\\ \vdots\\ 1 \end{array}\right] \end{align*} \]
Likewise a vector of zeros is denoted as \[ \begin{align*} {\bf 0} & =\left[\begin{array}{c} 0\\ 0\\ \vdots\\ 0 \end{array}\right] \end{align*} \]
10.4.11 Matrix Addition and Subtraction
Adding or subtracting two matrices requires that they have the same dimension.
The sum, or difference, of two matrices is another matrix whose elements each consist of the sum, or difference, of the corresponding elements of the two matrices.
Suppose: \[ \begin{align*} \underset{3\times2}{\textbf{A}}=\left[\begin{array}{cc} 1 & 4\\ 2 & 5\\ 3 & 6 \end{array}\right] & \qquad\underset{3\times2}{\textbf{B}}=\left[\begin{array}{cc} 1 & 2\\ 2 & 3\\ 3 & 4 \end{array}\right] \end{align*} \] then \[ \begin{align*} \underset{3\times2}{\textbf{A}+\textbf{B}=} & \left[\begin{array}{cc} 1+1 & 4+2\\ 2+2 & 5+3\\ 3+3 & 6+4 \end{array}\right]=\left[\begin{array}{cc} 2 & 6\\ 4 & 8\\ 6 & 10 \end{array}\right] \end{align*} \]
Similarly: \[ \begin{align*} \underset{3\times2}{\textbf{A}-\textbf{B}=} & \left[\begin{array}{cc} 1-1 & 4-2\\ 2-2 & 5-3\\ 3-3 & 6-4 \end{array}\right]=\left[\begin{array}{cc} 0 & 2\\ 0 & 2\\ 0 & 2 \end{array}\right] \end{align*} \]
10.4.12 Matrix Multiplication
The addition and subtraction rules discussed above are fairly straightforward and similar to addition and subtraction of (non-matrix) numbers.
Multiplication of matrices is not as straightforward as multiplication of (non-matrix) numbers.
Multiplication of a Matrix by a Scalar
A scalar is an ordinary number or a symbol representing a number.
In multiplication of a matrix by a scalar, every element of the matrix is multiplied by the scalar.
For example, suppose the matrix \(\textbf{A}\) is given by \[ \begin{align*} \textbf{A}=\left[\begin{array}{cc} 1 & 3\\ 5 & 7 \end{array}\right] \end{align*} \]
Then \(2\textbf{A}\), where 2 is the scalar, equals \[ \begin{align*} 2\textbf{A}=2\left[\begin{array}{cc} 1 & 3\\ 5 & 7 \end{array}\right] & =\left[\begin{array}{cc} 2 & 6\\ 10 & 14 \end{array}\right] \end{align*} \]
Multiplication of a Matrix by a Matrix
Consider the two matrices: \[ \begin{align*} \underset{2\times2}{\textbf{A}}=\left[\begin{array}{cc} 1 & 2\\ 3 & 4 \end{array}\right] & \qquad\underset{2\times2}{\textbf{B}}=\left[\begin{array}{cc} 5 & 6\\ 7 & 8 \end{array}\right] \end{align*} \]
Multiplying \(\bf{A}\) by \(\bf{B}\) is found by a multiplying the elements of each row vector by the elements of each each column vector and then summing the products.
For example, to find the element in the first row and the first column of the product \(\textbf{AB}\), we work with the first row of \(\textbf{A}\) and the first column of \(\textbf{B}\): \[ \begin{align*} \begin{array}{cc} & \textbf{A}\\ & \left[\begin{array}{cc} {\color{red}1} & {\color{red}2}\\ 3 & 4 \end{array}\right]\\ \\ \end{array}\begin{array}{c} \textbf{B}\\ \left[\begin{array}{cc} {\color{red}5} & 6\\ {\color{red}7} & 8 \end{array}\right]\\ \begin{array}{cc} & \end{array} \end{array} & =\begin{array}{cc} & \textbf{AB}\\ & \left[\begin{array}{cc} \color{red}{\left(1\right)\left(5\right)+\left(2\right)\left(7\right)} &\\ \\ \end{array}\right]\\ \\ \end{array}\\ & = \begin{array}{cc} & \textbf{AB}\\ & \left[\begin{array}{cc} \color{red}{19} &\\ \\ \end{array}\right]\\ \\ \end{array} \end{align*} \]
To find the element in the first row and second column of \(\textbf{AB}\): \[ \begin{align*} \begin{array}{cc} & \textbf{A}\\ & \left[\begin{array}{cc} {\color{red}1} & {\color{red}2}\\ 3 & 4 \end{array}\right]\\ \\ \end{array}\begin{array}{c} \textbf{B}\\ \left[\begin{array}{cc} 5 & \color{red}{6}\\ 7 & \color{red}{8} \end{array}\right]\\ \begin{array}{cc} & \end{array} \end{array} & =\begin{array}{cc} & \textbf{AB}\\ & \left[\begin{array}{cc} 33& \color{red}{\left(1\right)\left(6\right)+\left(2\right)\left(8\right)} \\ \\ \end{array}\right]\\ \\ \end{array}\\ & = \begin{array}{cc} & \textbf{AB}\\ & \left[\begin{array}{cc} 33 & \color{red}{22}\\ \\ \end{array}\right]\\ \\ \end{array} \end{align*} \]
Continuing this process we get \[ \begin{align*} \underset{2\times2}{\textbf{AB}} & =\left[\begin{array}{cc} \left(1\right)\left(5\right)+\left(2\right)\left(7\right) & \left(1\right)\left(6\right)+\left(2\right)\left(8\right)\\ \left(3\right)\left(5\right)+\left(4\right)\left(7\right) & \left(3\right)\left(6\right)+\left(4\right)\left(8\right) \end{array}\right]=\left[\begin{array}{cc} 19 & 22\\ 43 & 50 \end{array}\right] \end{align*} \]
Note that the order in matrix multiplication is important. In general, \(\textbf{AB} \ne \textbf{BA}\). In fact, even though the product \(\textbf{AB}\) may be defined, the product \(\textbf{BA}\) may not be defined at all.
In general, the product \(\textbf{AB}\) is defined only when the number of columns in \(\textbf{A}\) equals the number of rows in \(\textbf{B}\).
ExampleExample 10.7: Checking whether matrix multiplication is defined
In regression matrix notation, the fitted values can be written as
\[ \hat{\bf Y}={\bf X}{\bf b}. \]
If there are \(n\) observations and \(p\) regression parameters, then
\[ \underset{n\times p}{\bf X}\quad \underset{p\times 1}{\bf b} = \underset{n\times 1}{\hat{\bf Y}}. \]
The multiplication is defined because the number of columns in \(\bf X\) equals the number of rows in \(\bf b\). The result is an \(n\times1\) vector, one fitted value for each observation.
This is a useful way to check whether a matrix formula makes sense: the inner dimensions must match, and the outer dimensions tell you the size of the result.
For example: \[ \begin{align*} \underset{{\color{red}2}\times{\color{blue}3}}{\textbf{A}} & \quad\underset{{\color{blue}3}\times{\color{red}1}}{\textbf{B}}=\underset{{\color{red}2}\times{\color{red}1}}{\textbf{AB}} \end{align*} \] is defined since the number of columns of \(\textbf{A}\) (3) is equal to the number of rows of \(\textbf{B}\) (3).
However, note that \[ \begin{align*} \underset{{\color{blue}3}\times{\color{red}1}}{\textbf{B}}\quad\underset{{\color{red}2}\times{\color{blue}3}}{\textbf{A}} \end{align*} \] is not defined since the number of columns of \(\textbf{B}\) (1) is not equal to the number of rows of \(\textbf{A}\) (2).
When obtaining the product \(\textbf{AB}\), we say that \(\textbf{A}\) is postmultiplied by \(\textbf{B}\) or \(\textbf{B}\) is premultiplied by \(\textbf{A}\).
Inverse of a Matrix
For ordinary (non-matrix) numbers, the inverse of a number is its reciprocal. Thus, the inverse of 2 is \(\frac{1}{2}\)
A number multiplied by its inverse always equals 1: \[ \begin{align*} &2\cdot\frac{1}{2}=\frac{1}{2}\cdot2=1 \end{align*} \]
In matrix algebra, the inverse of a matrix \(\textbf{A}\) is another matrix, denoted by \(\textbf{A}^{-1}\), such that: \[ \textbf{A}^{-1}\textbf{A}=\textbf{A}\textbf{A}^{-1}=\textbf{I} \] where \(\textbf{I}\) is the identity matrix.
Thus, the identity matrix \(\textbf{I}\) plays the same role as the number 1 in ordinary algebra.
An inverse of a matrix is defined only for square matrices.
Even so, many square matrices do not have inverses.
If a square matrix does have an inverse, the inverse is unique.
If the inverse of a matrix does not exist, then we say the matrix is singular. If the inverse does exist, then we say the matrix is nonsingular.
WarningWhy singular matrices matter in regression
In multiple regression, the least-squares estimates can be written using a matrix inverse. In the next chapter, this will appear as
\[ {\bf b}=({\bf X}'{\bf X})^{-1}{\bf X}'{\bf Y}. \]
This formula only works if \({\bf X}'{\bf X}\) has an inverse. If predictors are perfectly redundant, such as including the same variable twice or including one predictor that is an exact linear combination of others, then \({\bf X}'{\bf X}\) becomes singular and the usual least-squares estimates are not uniquely defined.
This is the matrix-algebra version of a regression idea: the model cannot separately estimate effects that the data cannot separate.
ExampleExample 10.8: Verifying the matrix formula for least squares
The usual matrix formula for the least-squares coefficient estimates is
\[ {\bf b}=({\bf X}'{\bf X})^{-1}{\bf X}'{\bf Y}. \]
For the trees model, R’s model.matrix() creates the design matrix \({\bf X}\). The first column is the intercept column of ones, and the remaining columns are the predictors.
X <- model.matrix(trees_fit)
Y <- trees$Volume

matrix_estimates <- solve(t(X) %*% X) %*% t(X) %*% Y

comparison <- tibble::tibble(
  term = names(coef(trees_fit)),
  matrix_formula = as.numeric(matrix_estimates),
  lm_estimate = as.numeric(coef(trees_fit)),
  difference = as.numeric(matrix_estimates) - as.numeric(coef(trees_fit))
)

knitr::kable(comparison, digits = 10)| term | matrix_formula | lm_estimate | difference |
|---|---|---|---|
| (Intercept) | -57.9876589 | -57.9876589 | 0 |
| Girth | 4.7081605 | 4.7081605 | 0 |
| Height | 0.3392512 | 0.3392512 | 0 |
The matrix formula and lm() give the same coefficient estimates. In practice, we usually rely on software such as lm() because it uses numerically stable methods, but this calculation shows where the familiar regression estimates come from.
10.4.13 Basic Matrix Results
Below are some basic results for matrices presented without proof. They will be useful as we use matrices in regression. \[ \begin{align} \textbf{A}+\textbf{B} & =\textbf{B}+\textbf{A} &\\ \left(\textbf{A}+\textbf{B}\right)+\textbf{C} & =\textbf{A}+\left(\textbf{B}+\textbf{C}\right) &\\ \left(\textbf{A}\textbf{B}\right)\textbf{C} & =\textbf{A}\left(\textbf{B}\textbf{C}\right)&\\ \textbf{C}\left(\textbf{A}+\textbf{B}\right) & =\textbf{C}\textbf{A}+\textbf{C}\textbf{B}&\\ k\left(\textbf{A}+\textbf{B}\right) & =k\textbf{A}+k\textbf{B}&\\ \left(\textbf{A}^{\prime}\right)^{\prime} & =\textbf{A}&\\ \left(\textbf{A}+\textbf{B}\right)^{\prime} & =\textbf{A}^{\prime}+\textbf{B}^{\prime}&\\ \left(\textbf{A}\textbf{B}\right)^{\prime} & =\textbf{B}^{\prime}\textbf{A}^{\prime}&\\ \left(\textbf{A}\textbf{B}\textbf{C}\right)^{\prime} & =\textbf{C}^{\prime}\textbf{B}^{\prime}\textbf{A}^{\prime}&\\ \left(\textbf{A}^{-1}\right)^{-1} & =\textbf{A}&\\ \left(\textbf{A}^{\prime}\right)^{-1} & =\left(\textbf{A}^{-1}\right)^{\prime}& \end{align} \]
10.4.14 Matrix Differentiation
There are a number of results when using matrix calculus which are beyond the scope of this course. We will present a few results for matrix differentiation that will be useful in multiple regression.
It is important to note that matrix calculus can be confusing due to notational conventions that are used in various fields. There are two main conventions (although the two are sometimes mixed by some authors) that are based how to take a derivative with respect to a vector. One convention is the numerator layout and the other is the denominator layout. Below, we will present the results using numerator layout.
In all the results that follow, let \(d\) be a scalar, \({\bf A}\) be a \(n\times1\) vector with elements \([a_{i}]\), \({\bf B}\) be a \(m\times1\) vector with elements \([b_{i}]\), and \({\bf C}\) be a \(p\times q\) matrix with elements \([c_{ij}]\).
Vector by a Scalar
\[ \begin{align*} \frac{\partial{\bf A}}{\partial d} & =\left[\begin{array}{c} \frac{\partial a_{1}}{\partial d}\\ \frac{\partial a_{2}}{\partial d}\\ \vdots\\ \frac{\partial a_{n}}{\partial d} \end{array}\right] \end{align*} \]
Scalar by a Vector
\[ \begin{align*} \frac{\partial d}{\partial{\bf A}} =\left[\begin{array}{cccc} \frac{\partial d}{\partial a_{1}} & \frac{\partial d}{\partial a_{2}} & \cdots & \frac{\partial d}{\partial a_{n}}\end{array}\right] \end{align*} \]
Vector by a Vector
\[ \begin{align*} \frac{\partial{\bf A}}{\partial{\bf B}} & =\left[\begin{array}{cccc} \frac{\partial a_{1}}{\partial b_{1}} & \frac{\partial a_{1}}{\partial b_{2}} & \cdots & \frac{\partial a_{1}}{\partial b_{m}}\\ \frac{\partial a_{2}}{\partial b_{1}} & \frac{\partial a_{2}}{\partial b_{2}} & \cdots & \frac{\partial a_{2}}{\partial b_{m}}\\ \vdots & \vdots & \ddots & \vdots\\ \frac{\partial a_{n}}{\partial b_{1}} & \frac{\partial a_{n}}{\partial b_{2}} & \cdots & \frac{\partial a_{n}}{\partial b_{m}} \end{array}\right] \end{align*} \]
Matrix by a Scalar
\[ \begin{align*} \frac{\partial{\bf C}}{\partial d} & =\left[\begin{array}{cccc} \frac{\partial c_{11}}{\partial d} & \frac{\partial c_{12}}{\partial d} & \cdots & \frac{\partial c_{1q}}{\partial d}\\ \frac{\partial c_{21}}{\partial d} & \frac{\partial c_{22}}{\partial d} & \cdots & \frac{\partial c_{2q}}{\partial d}\\ \vdots & \vdots & \ddots & \vdots\\ \frac{\partial c_{p1}}{\partial d} & \frac{\partial c_{p2}}{\partial d} & \cdots & \frac{\partial c_{pq}}{\partial d} \end{array}\right] \end{align*} \]
Scalar by a Matrix
\[ \begin{align*} \frac{\partial d}{\partial{\bf C}} & =\left[\begin{array}{cccc} \frac{\partial d}{\partial c_{11}} & \frac{\partial d}{\partial c_{21}} & \cdots & \frac{\partial d}{\partial c_{p1}}\\ \frac{\partial d}{\partial c_{12}} & \frac{\partial d}{\partial c_{22}} & \cdots & \frac{\partial d}{\partial c_{p2}}\\ \vdots & \vdots & \ddots & \vdots\\ \frac{\partial d}{\partial c_{1q}} & \frac{\partial d}{\partial c_{2q}} & \cdots & \frac{\partial d}{\partial c_{pq}} \end{array}\right] \end{align*} \]
Common Derivatives Involving Matrices
\[ \begin{align*} & \frac{\partial{\bf A}^{\prime}{\bf A}}{\partial{\bf A}}=2{\bf A}^{\prime}\\ & \frac{\partial{\bf A}^{\prime}{\bf B}}{\partial{\bf B}}=\frac{\partial{\bf B}^{\prime}{\bf A}}{\partial{\bf B}}={\bf A}^{\prime} & & \text{(provided }m=n)\\ & \frac{\partial{\bf \left({\bf A}^{\prime}{\bf B}\right)^{2}}}{\partial{\bf A}}=2{\bf A}^{\prime}{\bf B}{\bf B}^{\prime} & & \text{(provided }m=n)\\ & \frac{\partial{\bf C}{\bf A}}{\partial{\bf A}}={\bf C} & & \text{(provided }q=n)\\ & \frac{\partial{\bf A}^{\prime}{\bf C}}{\partial{\bf A}}={\bf C}^{\prime} & & \text{(provided }p=n)\\ & \frac{\partial{\bf A}^{\prime}{\bf C}{\bf A}}{\partial{\bf A}}={\bf A}^{\prime}\left({\bf C}+{\bf C}^{\prime}\right) & & \text{(provided }n=p=q) \end{align*} \]
10.4.15 Random Matrices
A random matrix contains elements that are random variables.
Thus, the vector of the response vector \[ \begin{align*} {\bf Y} & =\left[\begin{array}{c} Y_{1}\\ Y_{2}\\ \vdots\\ Y_{n} \end{array}\right] \end{align*} \] is a random vector since the \(Y_i\) elements are random variables.
Expected Value
The expected value of \({\bf Y}\) is a matrix (or vector) that has elements that are the expected values of the elements of \({\bf Y}\). Thus, \[ \begin{align*} {\bf E}\left[{\bf Y}\right] & =\left[\begin{array}{c} E\left[Y_{1}\right]\\ E\left[Y_{2}\right]\\ \vdots\\ E\left[Y_{n}\right] \end{array}\right] \end{align*} \]
Variance-Covariance Matrix
When working with random vectors, we will be interested in the variance of the individual elements \[ \begin{align*} Var\left[Y_{i}\right] \end{align*} \] along with the covariance between pairs of elements \[ \begin{align*} Cov\left[Y_{i},Y_{j}\right] & \text{ }i\ne j. \end{align*} \]
All of these variances and covariances are given in the variance-covariance matrix or simply covariance matrix: \[ \begin{align*} {\bf Cov}\left[{\bf Y}\right] & =\left[\begin{array}{cccc} Var\left[Y_{1}\right] & Cov\left[Y_{1},Y_{2}\right] & \cdots & Cov\left[Y_{1},Y_{n}\right]\\ Cov\left[Y_{2},Y_{1}\right] & Var\left[Y_{2}\right] & \cdots & Cov\left[Y_{2},Y_{n}\right]\\ \vdots & \vdots & \ddots & \vdots\\ Cov\left[Y_{n},Y_{1}\right] & Cov\left[Y_{n},Y_{2}\right] & \cdots & Var\left[Y_{n}\right] \end{array}\right] \end{align*} \]
Note that \({\bf Cov}\left[{\bf Y}\right]\) is a symmetric matrix since \(Cov\left[Y_{i},Y_{j}\right]=Cov\left[Y_{j},Y_{i}\right]\).
ExampleExample 10.9: Independent errors and the covariance matrix
In the usual regression model, the error terms are assumed to be independent with common variance \(\sigma^2\). In matrix notation, that assumption can be written as
\[ {\bf Cov}({\boldsymbol \varepsilon})=\sigma^2{\bf I}. \]
For three observations, this means
\[ {\bf Cov}({\boldsymbol \varepsilon})= \sigma^2 \left[ \begin{array}{ccc} 1 & 0 & 0\\ 0 & 1 & 0\\ 0 & 0 & 1 \end{array} \right] = \left[ \begin{array}{ccc} \sigma^2 & 0 & 0\\ 0 & \sigma^2 & 0\\ 0 & 0 & \sigma^2 \end{array} \right]. \]
The diagonal entries are variances. The off-diagonal entries are covariances. The zeros off the diagonal represent independence between different errors.
10.5 Recap
This chapter introduced multiple regression and the matrix notation that will make later regression results easier to state.
| Idea | Meaning |
|---|---|
| Multiple regression | A regression model with two or more predictor variables. |
| Linear in the parameters | Each parameter appears to the first power and is not multiplied or divided by another parameter. |
| First-order model | A model that is linear in both the parameters and the predictor variables. |
| Partial slope | The expected change in the response for a one-unit change in one predictor, holding the other predictors constant. |
| Common partial-slope mistake | Interpreting a multiple-regression slope as a simple bivariate relationship instead of a conditional relationship. |
| Multicollinearity | Correlation among predictor variables; it can make individual predictor effects harder to estimate and interpret. |
| Least squares | Chooses coefficient estimates by minimizing the sum of squared residuals. |
| Regression plane | The fitted surface produced by a model with two predictors. |
| Design matrix | The matrix \({\bf X}\) containing the intercept column and predictor columns used in the regression model. |
| Matrix least-squares formula | The coefficient estimates can be written as \({\bf b}=({\bf X}'{\bf X})^{-1}{\bf X}'{\bf Y}\) when the inverse exists. |
| Matrix dimension | Written as rows \(\times\) columns. |
| Transpose | Interchanges rows and columns of a matrix. |
| Identity matrix | A diagonal matrix with ones on the diagonal; it acts like the number 1 in matrix multiplication. |
| Inverse matrix | A matrix \({\bf A}^{-1}\) such that \({\bf A}^{-1}{\bf A}={\bf A}{\bf A}^{-1}={\bf I}\). |
| Singular matrix | A square matrix with no inverse. |
| Covariance matrix | A matrix that stores variances on the diagonal and covariances off the diagonal. |
10.6 Check your understanding
NoteProblems
Why is simple linear regression called “simple”?
What does it mean for a model to be linear in the parameters?
Can a model include \(x^2\) and still be a linear regression model? Explain.
In multiple regression, what does it mean to interpret a slope while “holding the other predictors constant”?
What is a common mistake when interpreting a multiple-regression slope?
Why can correlated predictors make interpretation harder?
In a model with two predictors, what does the regression plane represent?
What quantity does least squares minimize?
Why do the least-squares formulas become cumbersome as more predictors are added?
What is the design matrix \({\bf X}\)?
Why should the matrix formula \({\bf b}=({\bf X}'{\bf X})^{-1}{\bf X}'{\bf Y}\) agree with
lm()for the same model?If a matrix has 10 rows and 4 columns, what is its dimension?
What happens to the dimensions of a matrix when it is transposed?
When is the product \({\bf A}{\bf B}\) defined?
What role does the identity matrix play in matrix algebra?
Why is a singular matrix a problem for the usual matrix formula for least-squares estimates?
In a covariance matrix, where are the variances located?
What does it mean if the off-diagonal entries of an error covariance matrix are 0?
TipSolutions
One predictor. Simple linear regression is called “simple” because the model has one predictor variable.
Parameters appear linearly. A model is linear in the parameters when each parameter appears to the first power and is not multiplied or divided by another parameter.
Yes. A model such as \(y=\beta_0+\beta_1x+\beta_2x^2+\varepsilon\) is linear in the parameters even though it is not linear in the predictor variable. It is a linear regression model, but not a first-order model.
Partial interpretation. It means we interpret the effect of changing one predictor while comparing observations that have the same values of the other predictors in the model.
Forgetting the conditioning. A common mistake is to interpret a multiple-regression slope as the overall relationship between one predictor and the response. In multiple regression, the slope is conditional on the other predictors in the model.
Effects are harder to separate. When predictors are correlated, changes in one predictor tend to come with changes in another predictor. This makes it harder to isolate the unique contribution of each predictor.
The fitted surface. The regression plane represents the fitted values from a model with two predictors. Observed points can fall above or below the plane, and those vertical differences are residuals.
The sum of squared residuals. Least squares chooses estimates that minimize the sum of squared differences between observed values and fitted values.
More parameters create more equations. Each additional predictor adds another coefficient and another normal equation. The algebra grows quickly, which motivates matrix notation.
The model-input matrix. The design matrix \({\bf X}\) contains the intercept column and the predictor columns used to fit the regression model.
They estimate the same least-squares coefficients. The matrix formula is the algebraic expression for ordinary least squares. For the same response, predictors, and intercept convention, it gives the same estimates as
lm().\(10\times4\). Matrix dimensions are written as rows \(\times\) columns.
Rows and columns switch. The transpose of a \(10\times4\) matrix is a \(4\times10\) matrix.
Inner dimensions must match. The product \({\bf A}{\bf B}\) is defined when the number of columns in \({\bf A}\) equals the number of rows in \({\bf B}\).
It acts like 1. The identity matrix plays the role of 1 in matrix multiplication: multiplying by the identity leaves a compatible matrix unchanged.
No inverse. The usual matrix formula for least-squares estimates uses \(({\bf X}'{\bf X})^{-1}\). If \({\bf X}'{\bf X}\) is singular, that inverse does not exist, so the usual formula cannot be used.
On the diagonal. The variances are the diagonal entries of the covariance matrix.
Zero covariance. Off-diagonal zeros mean the corresponding errors have covariance 0. Under the usual regression assumptions, this represents no linear association between different error terms and is tied to the independence assumption.